Bubble maps are used to display data geographically, with bubbles used to represent values: the larger the bubble, the larger the value. When working with bubble maps, several formatting options are afforded that enable you to design the map according your needs. For instance, you can select the specific map type, customize the map colors, add zoom control buttons, and more.
Bubble Map Chart Formatting
Settings
Click Settings to set the map type and enable the map controls:
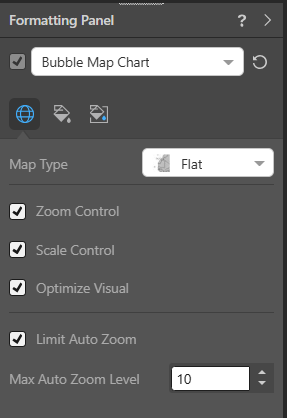
Map Type
Choose your required "map type." The map type indicates how the map itself should be drawn; for example, should it be a street view or a topology map. For more information, see Map Quick Styles.
Map Controls
- Zoom Control: Add zoom controls to the map.
- Scale Control: Show or hide the scale control.
- Optimize Visual: The visual optimization engine in Pyramid is a heuristic that automatically redacts certain parts of a graphical visualization based on the amount of space provided.
Auto Zoom Controls
By default, Pyramid will zoom to the map at the highest level of detail. Where an individual point is selected in the query, for example an individual building or an address, this may result in such a high level of zoom that the context of point on the map is lost. Limiting the level of zoom allows the user to define the level of detail shown, keeping the map point in visual context.
- Limit Auto Zoom: Enables the Auto Zoom Limit, limiting the degree of map zoom when individual or groups of data points are selected (Max Auto Zoom Level).
- Max Auto Zoom Level: Sets the Limit level from 0 (lowest zoom level) to 20 (highest zoom level).
Tip: For some map types, the Opacity control is also present here. For bubble maps, you can set the opacity for your bubbles under Shapes.
Fill
Click Fill to change the colors used for your visual background and map:
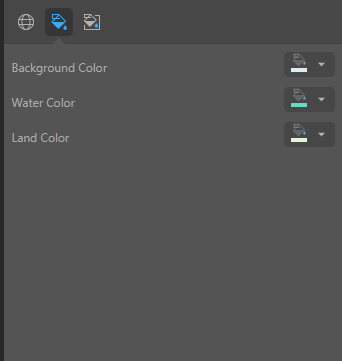
You can use the Color Picker to specify the different colors to use for your map:
- Background Color: Change the color of the map background.
- Water Color: Change the color of the water wherever it is shown on the map (lakes, rivers, sea, and so on).
- Land Color: Change the color of the land.
Note: Water and Land Color fill options are not relevant to Satellite Map Types.
Miniature
![]() Miniature Color 1, 2, and 3 set the text colors for miniature visuals, which appear automatically when a visual is scaled down due to legibility limits. These miniatures show measure values and labels for quick reading in limited space. Use the Color Picker to set the color for each miniature tile.
Miniature Color 1, 2, and 3 set the text colors for miniature visuals, which appear automatically when a visual is scaled down due to legibility limits. These miniatures show measure values and labels for quick reading in limited space. Use the Color Picker to set the color for each miniature tile.
Miniature visuals are created automatically when you scale a visual down to a size that makes its content illegible. These tiles typically display the measure as a number with its name underneath:
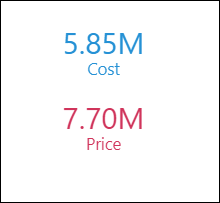
Note: The purpose of a miniature visual is to provide a way to easily view and interpret important data at a glance, even where there is a lot of information and limited space.